Home
Too slow speed values for the Boardman bicycle?
The rolling resistance data used for the calculator refer to asphalt road pavement.
On a smooth velodrome surface, rolling resistances can be expected to be essentially lower.
Too fast speed values for the lowracer recumbent?
The calculator uses data of the Kreuzotter race - which is a very fast lowracer that has a stiff frame, efficient train transmission, a seat height of 17 centimeters, and fairly optimized aerodynamics.
Your own lowracer is most probably slower...
When coasting downhill, my racing bicycle/lowracer/Quest is much slower than the Online Calculator gives!
Not surprising.
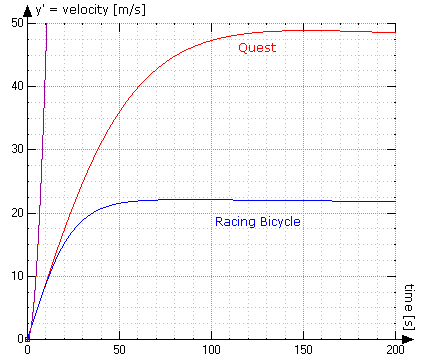
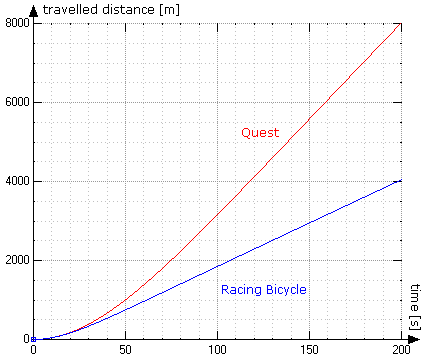
To reach it's final speed when coasting upon a continuous 10% downhill gradient,
a streamlined Quest would take
2 minutes 33 seconds or 5.7 kilometers,
a fast lowracer (Kreuzotter race)
1 minute 54 seconds or 2.9 km,
a racing bicyle (on the drops)
1 minute 26 seconds or 1.54 km.
Roads satisfying these criteria are not really commonplace.
Above values have been calculated using WZGrapher (a self-written function graph plotter which can numerically solve ordinary differential equations up to the 5. order, Freeware, currently Windows only).
The following motion equation takes into account also the slope (gradient) of the road, the gradient of air density (and temperature) when moving upon a slope, the normalized rolling resistance, the dynamic speed-dependent rolling resistance, and windspeed:
acceleration = (propulsion force - air drag - rolling resistance - slope pulling force - dynamic rolling resistance) / mass ,
that is:

with:
| y: | Dependent variable: Travelled Distance [m] |
| P: | Rider's power [W] (zero for coast-downhill simulations) |
| Vw: | Wind speed [m/s] (negative values: tailwind) |
| Ha: | Altitude of the starting point above sea level [m] |
| Ta: | Air temperature [°C] on the altitude of the starting point |
| β: |
Slope angle (negative angles: downhill).
If the slope is given in percent, atan(s/100) yields the slope angle
(either in radians or degrees, dependent on the calculation mode setting).
|
| M: | Total mass bicycle + rider [kg] |
| Cd: | Air drag coefficient bicycle + rider |
| A: |
Frontal area bicycle + rider [m2].
The effective drag area Cd*A can be obtained from the Bicycle Speed&Power Calculator |
| Cr: |
Rolling resistance coefficient (between 0.0025 and 0.008)
Approximated values can be obtained from the Bicycle Speed&Power Calculator |
| CrV: | Coefficient for the dynamic velocity-dependent rolling resistance (approximated to 0.1) |
| Cm: | Coefficient for mechanical losses (between 1.03 and 1.09, dependent from bicycle type) |
| ρ0: | Air density on sea level at 0° C (1.293 kg/m3) |
| p0: | Air pressure on sea level at 0° C (101325 Pa) |
| g: | Gravitational acceleration (9.81 m/s2) |


Quest versus Racing Bicycle coasting upon a downgrade of 10%, starting at an altitude of 800 m above sea level (Plot: WZGrapher)
What is the influence of pedaling cadence here?
The movements of the rider's legs increase the air drag:
The air drag force grows with the square of velocity =>
at any point of the pedaling circle, the air-drag increase by the forward-cranking (i.e. faster) leg prevails over the air-drag decrease by the backward-cranking (i.e. slower) leg.
Moreover, the vertical movements of the legs increase the air drag by adding themselves vectorially to the vehicle's speed,
and supposedly induce additional air vortices.
The influence of the pedaling cadence is approximated here by [original Cd*A] * (1 + cadence/500).
When comparing bicycles, why do coast-downhill speeds differ by a larger amount than speeds on flat road?
When coasting downhill, the propulsion forces (provided that total weights are identical) are equal, while on a flat road, the propulsion powers are equal.
Air-drag force grows with V2 but air-drag power with V3.
Therefore, a bicycle with better aerodynamics can gain less speed on a flat road (given propulsion power) than when coasting downhill (given propulsion force).
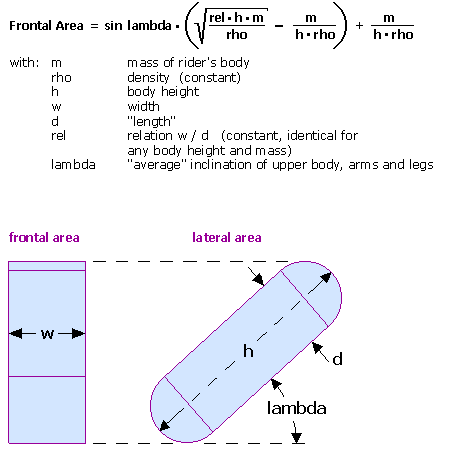
How is the rider's frontal area calculated from his body's height and weight?
The model used here simplifies the rider's body to a "square stone", with two half-cylinders glued onto it's top and bottom surfaces (see image).
These half-cylinders increase the precision of how the frontal area's vertical extent depends from the body inclination.
lambda resembles the the average of the inclination angles of the rider's upper body, arms and legs.
These angles vary with the concerned type of bicycle.
The used algorithm evaluates lambda by weighing the angles of upper body/legs/arms like 8/6/3.
These assumptions yield good matches with frontal area measurements, wind tunnel measurements (tour magazin, 1994), and with measurements done with SRM Power Measuring cranks.

Why are the values yielded for Cr (rolling resistance coefficient) so low?
Because the program takes also into account the dynamic speed-dependent rolling resistance CrV.
That is, the rolling resistance force is splitted into a constant and a dynamic share.
The value yielded in the Cr output text field is the coefficient for the constant share only.
Last modified: 11.9.2008 Impressum / About this page